OpManager
Powerful, user-friendly network monitoring software
With networks becoming even more complex over time, having a robust network monitoring solution in place is crucial. OpManager offers comprehensive network monitoring capabilities that help you monitor network performance, detect network faults in real time, troubleshoot errors, and prevent downtime. Being a powerful network monitor, it supports multi-vendor IT environments and can scale to fit your network, regardless of its size. Monitor your devices and network to gain complete visibility and control over your entire network infrastructure.

Networks are the backbone of every business. Even in small or enterprise-level businesses, the loss of productivity during a network outage can result in hefty damages. Network monitoring helps you anticipate potential outages and address network problems proactively. This helps in maintaining a congestion-free network that keeps your business up and running.
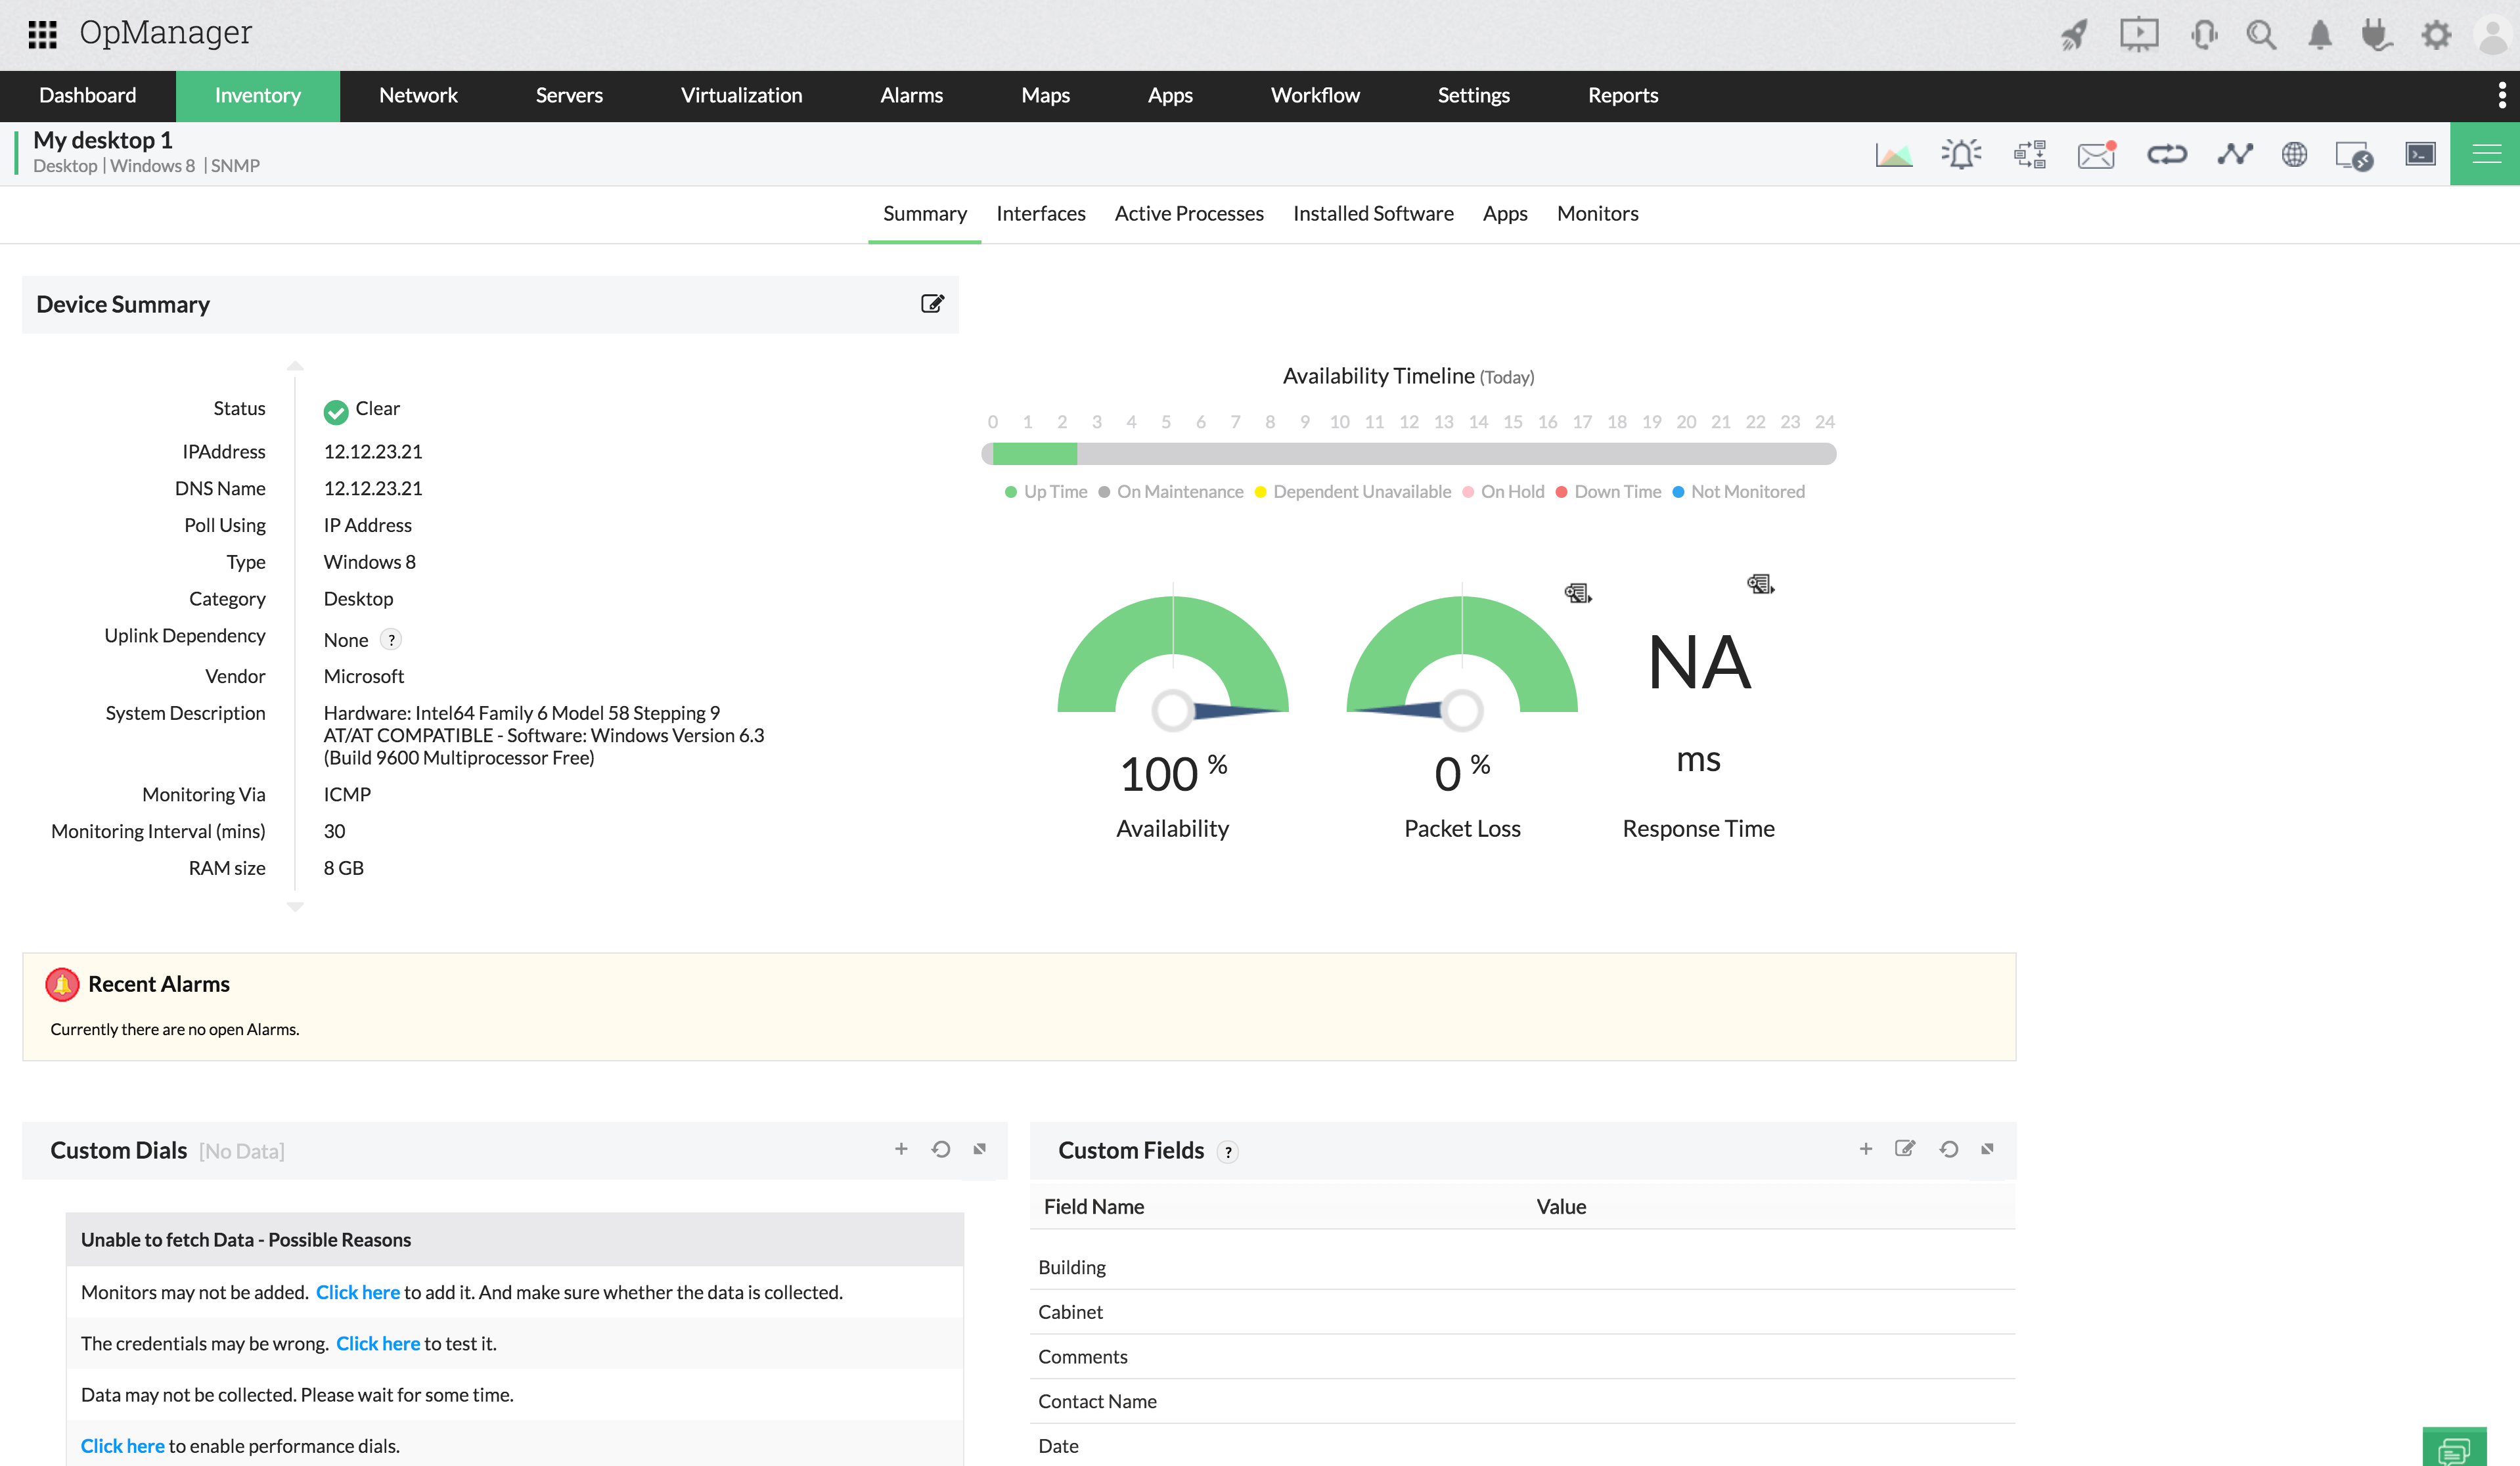
Factors that impact network performance.
When every minute of downtime can cost you thousands, if not millions of dollars, maintaining continuous uptime at all times is an absolute necessity. OpManager pings all monitored devices at defined monitoring intervals, and if any device is down or if the response time or packet loss is huge, OpManager notifies you immediately by sending an email or text message.
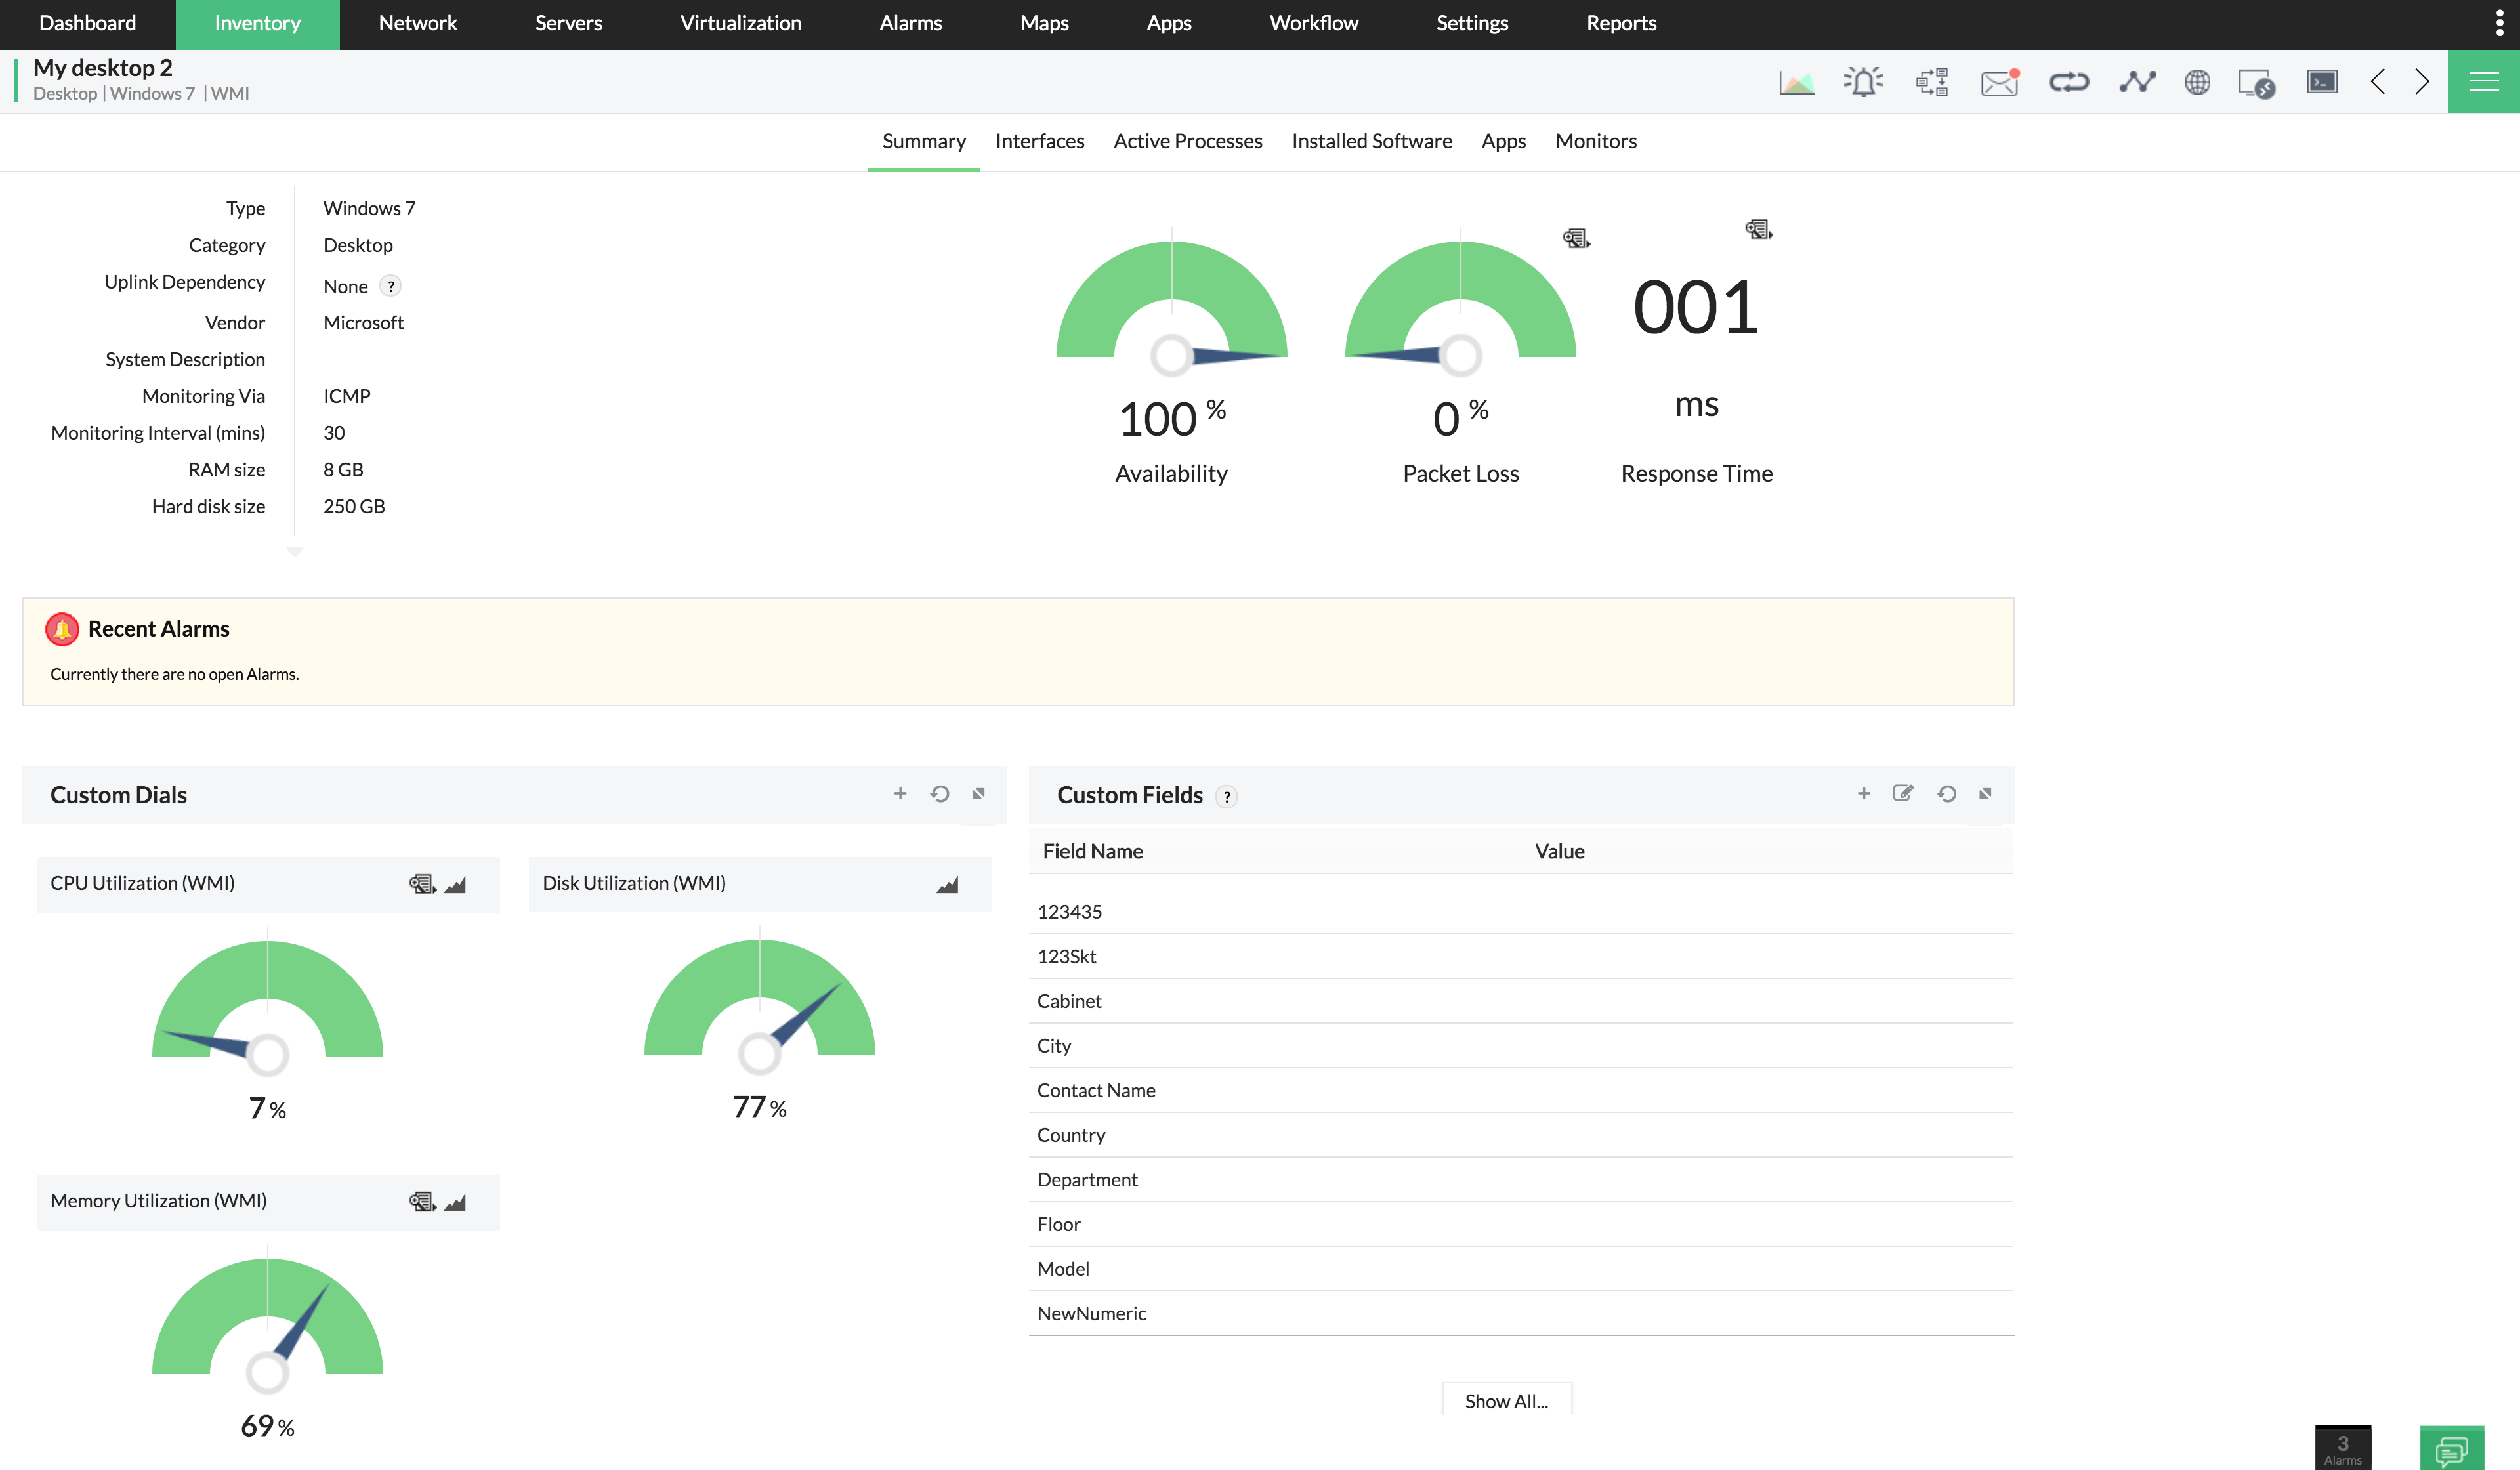
CPU and memory
High CPU or memory usage on a physical server, virtual machine, or network device can considerably affect the performance of devices and, in turn, affect the end user. OpManager lets you monitor devices using SNMP, WMI, Telnet, SSH, and VMware native API. With OpManager, you can detect and troubleshoot CPU and server bottlenecks before they affect the end user. You can also monitor important CPU metrics like utilization, speed, idle time, and processor time, and set independent alarm thresholds for each monitored device.
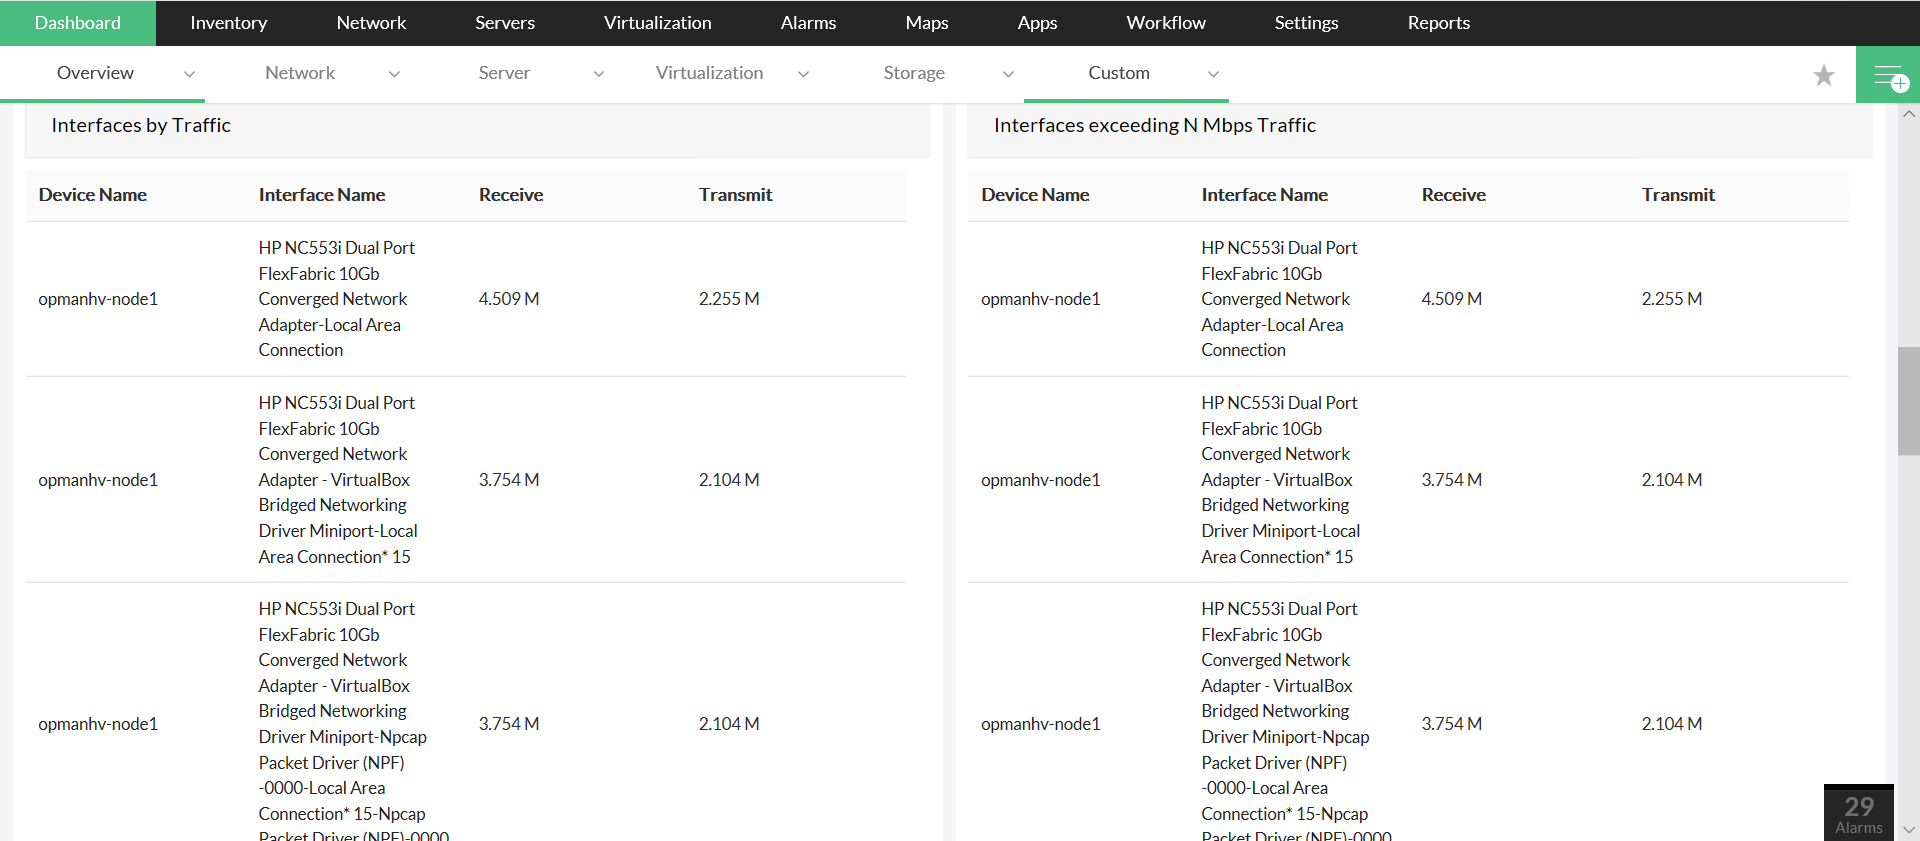
Traffic
Slow network traffic is a concern for every organization. Networks might face bandwidth-related issues due to a specific application, system, or WLAN. OpManager allows you identify bandwidth hogs so you can optimize your network traffic before it affects your network. Take charge of network performance monitoring by analyzing your network's bandwidth performance and traffic patterns with OpManager's Simple Network Management Protocol, which let's you monitor device traffic. You can view interface traffic, filter traffic by time interval, and view the last polled traffic value. OpManager's NetFlow module provides in-depth visibility on network traffic patterns and bandwidth utilization with support for NetFlow, sFlow, jFlow, IPFIX, and more.
Errors and discards
All network devices discard packets depending on their memory, which can effect performance. These problems are common with routers and switches. Since discards increase application latency, excessive discards could indicate that there's a problem with the switch or the device interacting with the switch. Insufficient bandwidth allocation is also a concern for packet drops. Network errors are diverse; they could be caused by a DNS issue, TCP timeout, or a lack of response from the server. A switch or router can misinterpret a packet due to a protocol mismatch when updating device configurations. OpManager helps you monitor and reduce the packet loss due to errors and discards.
WAN performance
Monitoring WAN links for availability and reliability is essential, as organizations require continuous uptime, fast response times, and minimal transmission errors, which makes monitoring WAN links for availability and reliability is essential. Most organizations use WAN links to interconnect local area networks (LANs) from different locations around the world. With OpManager, you can monitor your WAN connections, check WAN latency, and identify network traffic across your WAN network. This helps you allocate resources accordingly to prioritize traffic and react proactively to any issues affecting your WAN network. OpManager primarily relies on Cisco's IP-SLA for monitoring the WAN, while OpManager’s WAN Round Trip Time monitor provides details on WAN link latency, bandwidth utilization, the round trip time, and other performance factors for you to completely diagnose and resolve poor WAN performance before you can think of upgrading WAN bandwidth capacity.
Performance monitors
OpManager's predefined performance monitors help you take control of your devices and interfaces by setting up device-specific monitors to drill down on any particular aspect of a device that you want to monitor. OpManager supports setting up custom SNMP MIB variables and helps you manage and monitor performance for a wide range of devices from multiple vendors. OpManager supports the most commonly used devices in the market like Cisco, Palo Alto and Juniper.
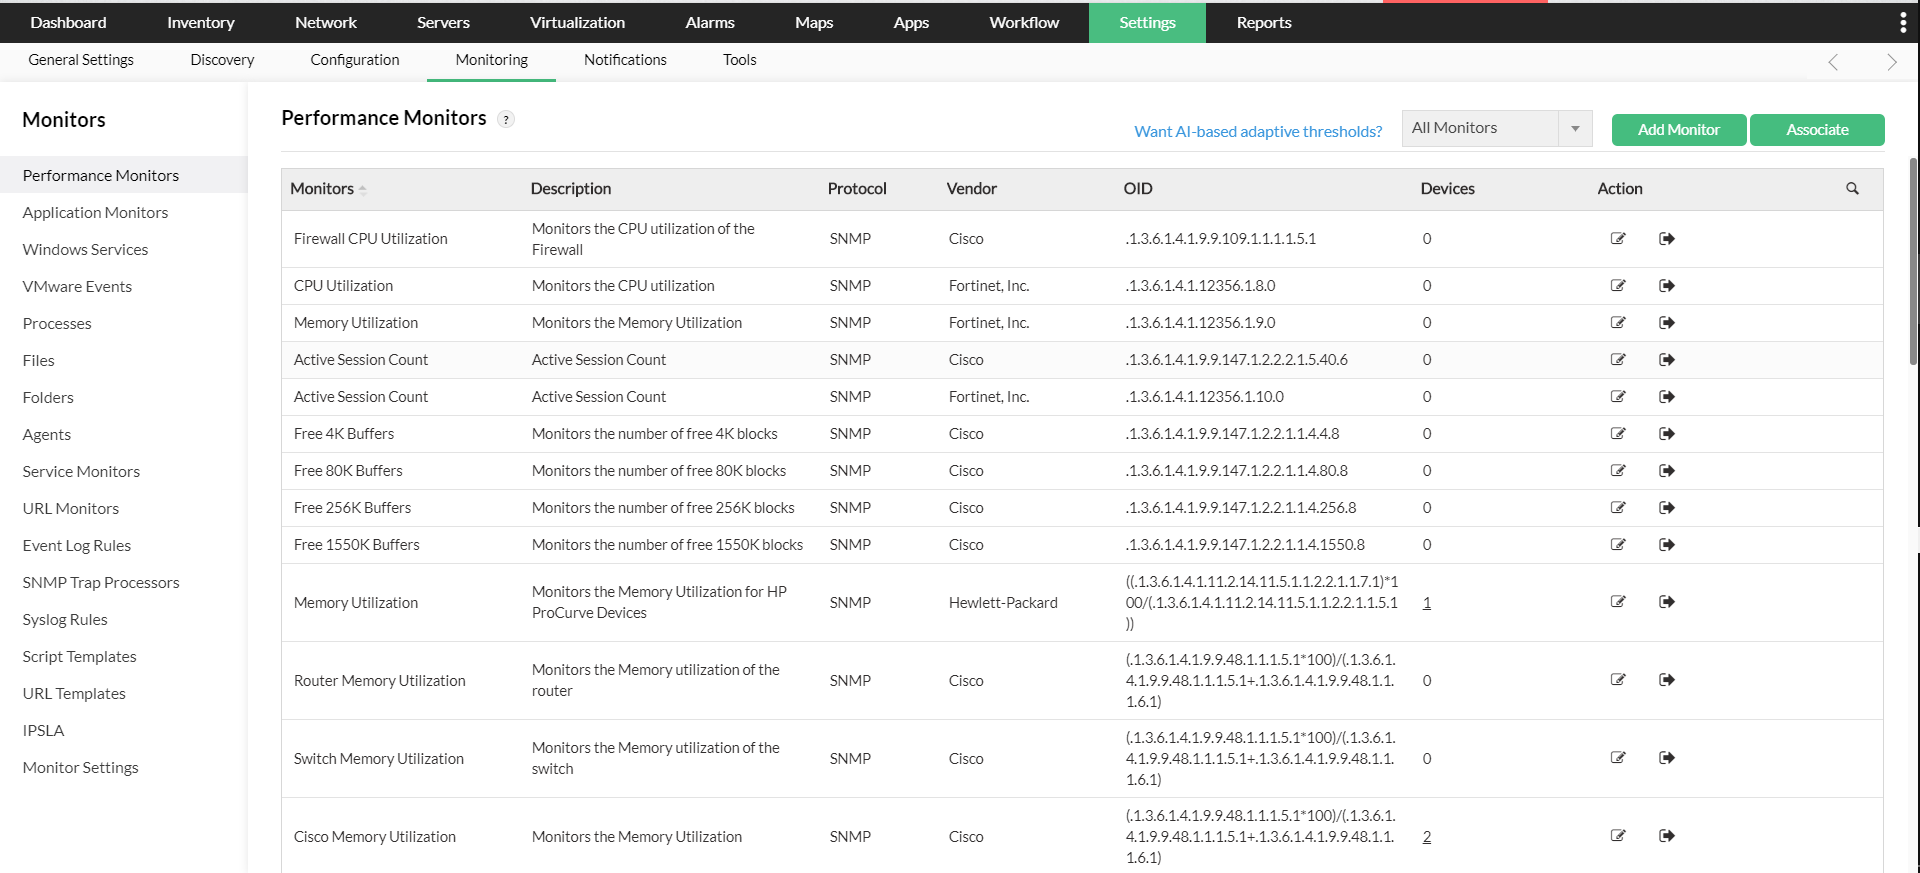
If the performance counter you're looking to monitor isn't available, you can always get the SNMP MIBs from the vendor and create custom SNMP monitors. You can also load the WMI classes from the device and create a monitor.
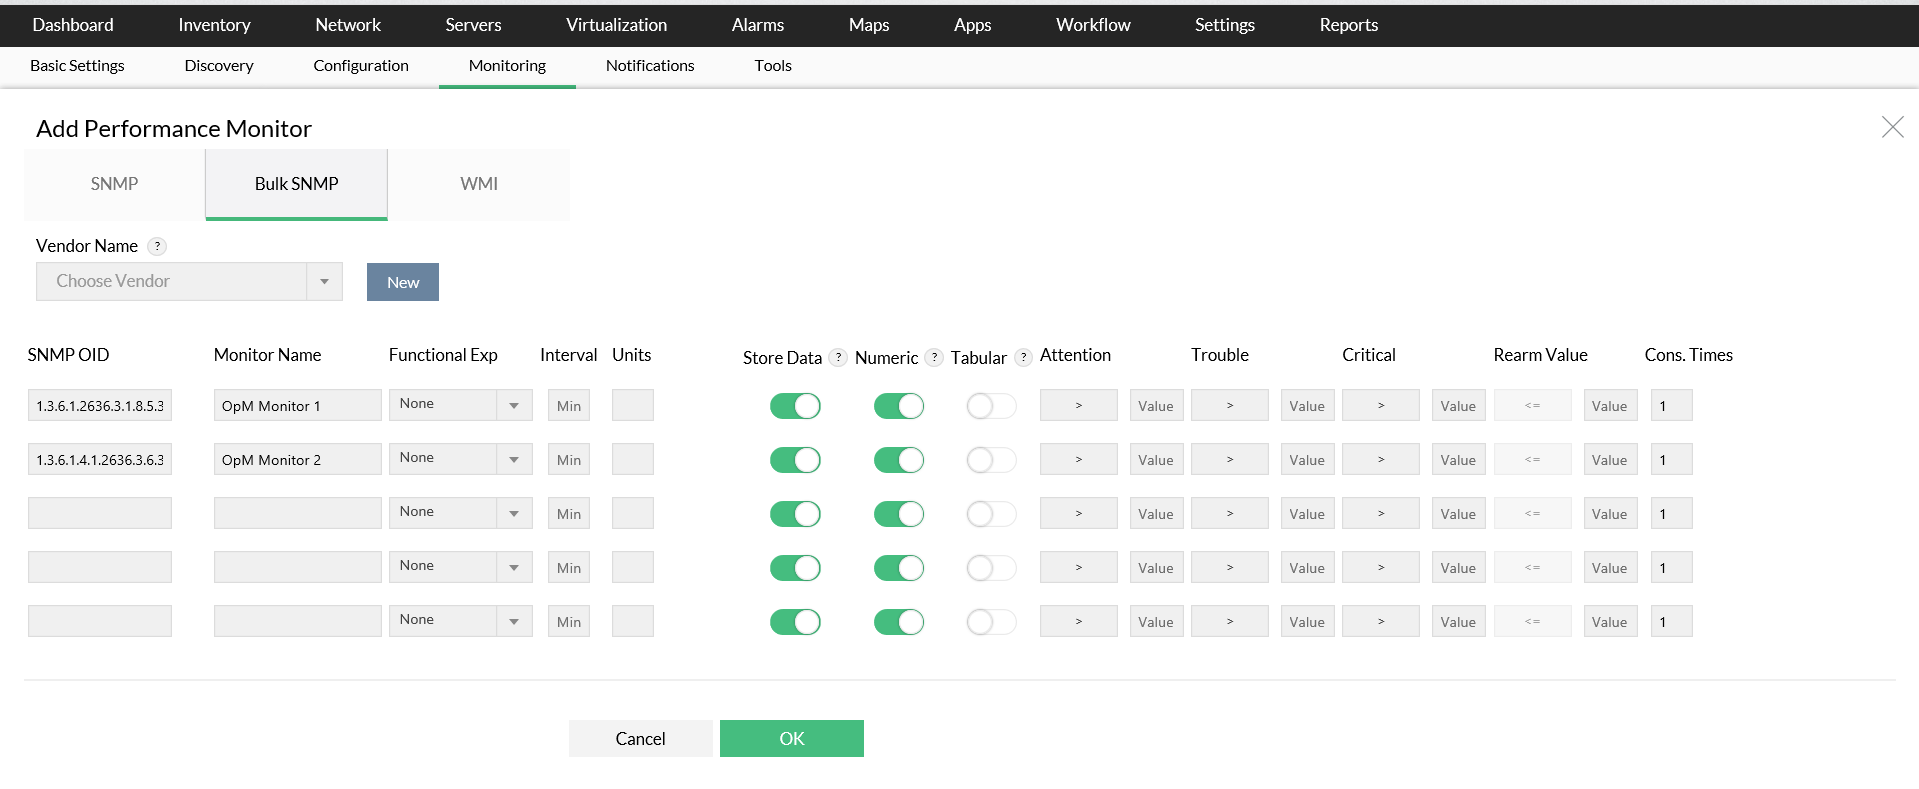
Apart from this, you can monitor TCP ports for availability and response time; Windows services for availability; processes for availability, CPU, and memory; files and folders for availability, size, and age; Windows event logs; and syslogs from Linux and network devices.
If you're using scripts to extract certain values from servers, you can monitor them using the same values in our script monitor. You can also get alerts based on set thresholds and generate reports based on the monitored value.
Proactively monitoring network performance
Network downtime can cost a lot of money. This is why network monitoring is a necessity. OpManager, a powerful network performance monitor, lets you monitor all your devices for availability, performance, traffic, and other parameters, so you can monitor issues proactively and prevent problems from bringing down your network.
Benefits of proactive monitoring:
Helps network administrators get an end-user perspective of network and application performance, which helps them detect and resolve issues easily.
Allows admins to test how a network performs under a certain load so you can better understand your network's bandwidth and see whether or not you need to better allocate resources.
Aids admins in identifying security threats and sudden spikes in traffic levels to reduce device downtime.
Lets you monitor your IP assets and equipment upgrades, and ensures smooth performance.
OpManager lets you take control of your network with proactive measures like:
Multi-level thresholds
Instant-notification support
Multi-level thresholds:
Configuring thresholds lets OpManager proactively monitor the resources and services running on servers and network devices. OpManager supports multi-level thresholds for classifying and breaking down any fault encountered and for raising alerts before the device goes down or reaches critical condition. Based on the level of severity, you can respond with the respective corrective action. OpManager allows you to configure multiple thresholds for the monitors that are associated to a single device. You can also apply the threshold across multiple devices.
Instant notification:
OpManager can notify you through SMS and/or email whenever an alarm occurs. Administrators can also configure OpManager to run external programs or homegrown scripts automatically when an alarm is triggered. OpManager not only performs intelligent event processing, but it also correlates raw network events, filters unwanted events, and presents only meaningful alarms to the user. It uses color-coded alarms presented in a user-friendly format. Administrators can view the event history associated with an alarm and manually clear or delete them. OpManager also allows you to set escalation rules so that no alarm goes unnoticed.
Network performance reports
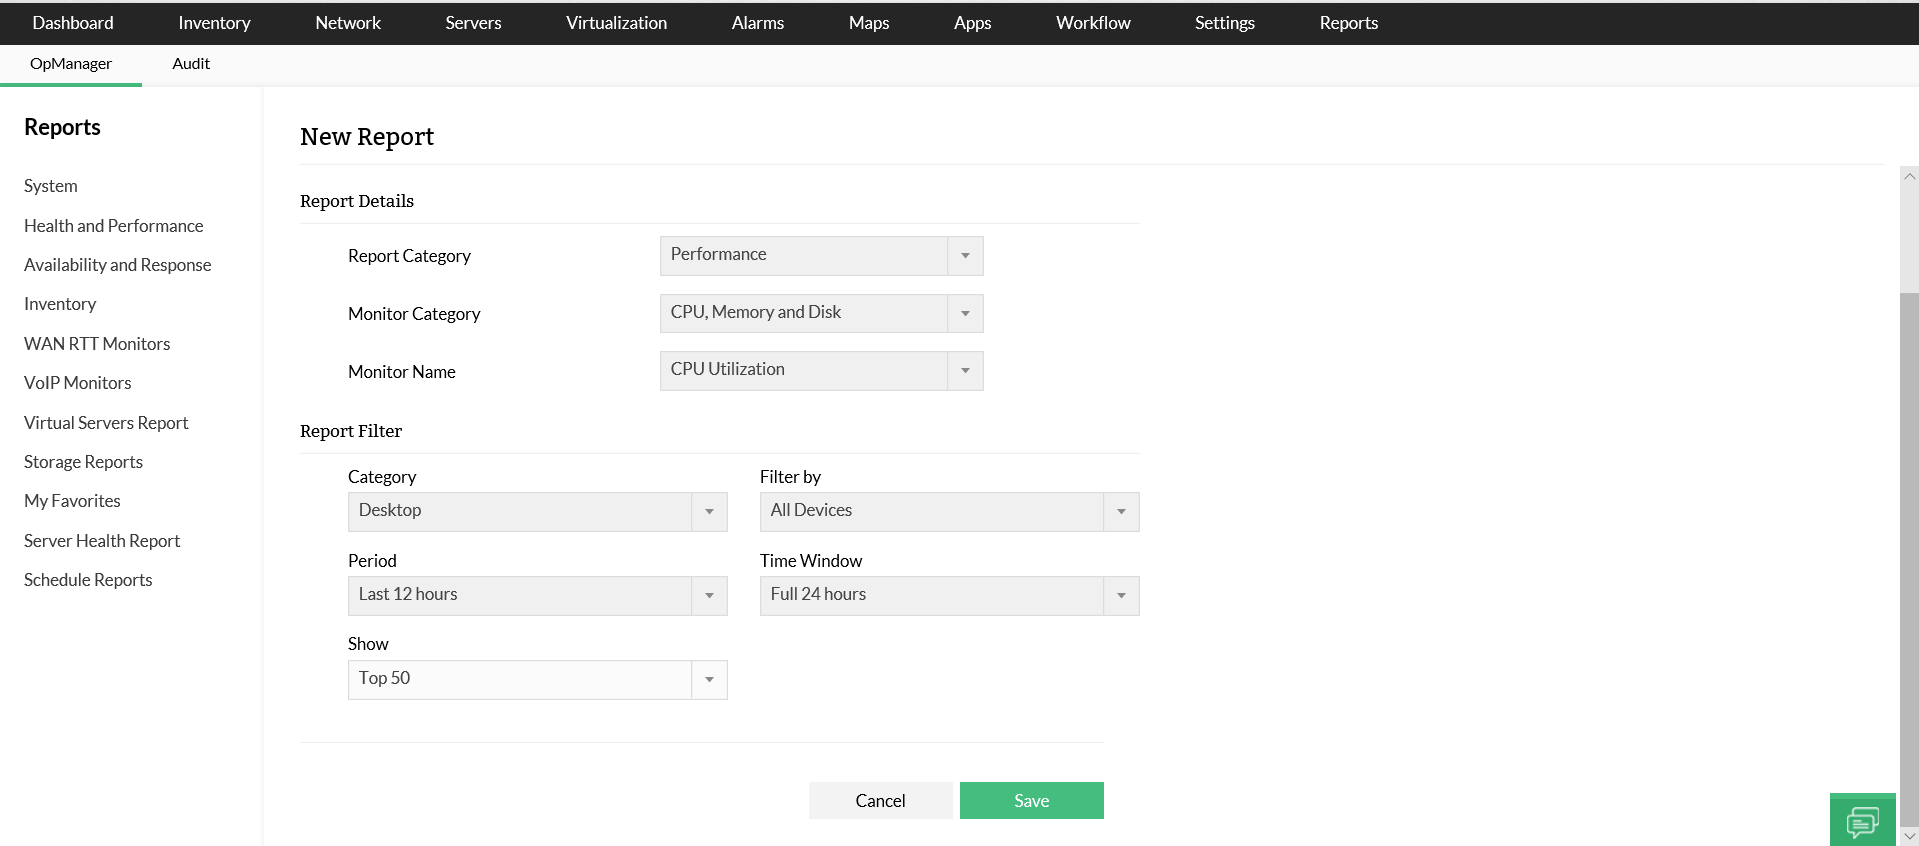
You might want to know how your network has performed over the year or within a specific time period. Tracking network performance metrics is easy with OpManager's Network Performance Reports. OpManager provides a simple interface with more than 100 built-in reporting profiles and over 125 out-of-box reports.
With OpManager, you can view intensive device performance reports like:
You can also create customized reports using OpManager.
With OpManager, you can export and save every report as a PDF or XLS file with the option to print or email them. You can also export reports as widgets and use them on your dashboard.
Network performance dashboards
OpManager provides customizable dashboards and various visualization options, which you can customize to suit each employee, from technicians to IT managers. Each user has the option to choose different widgets and customize the dashboard based on their needs. You can create your own floors and racks as they are in the data center and view the status of those devices using OpManager's 3D data center. If you just want to view a group of devices and the links between them, you can group them in the business view.
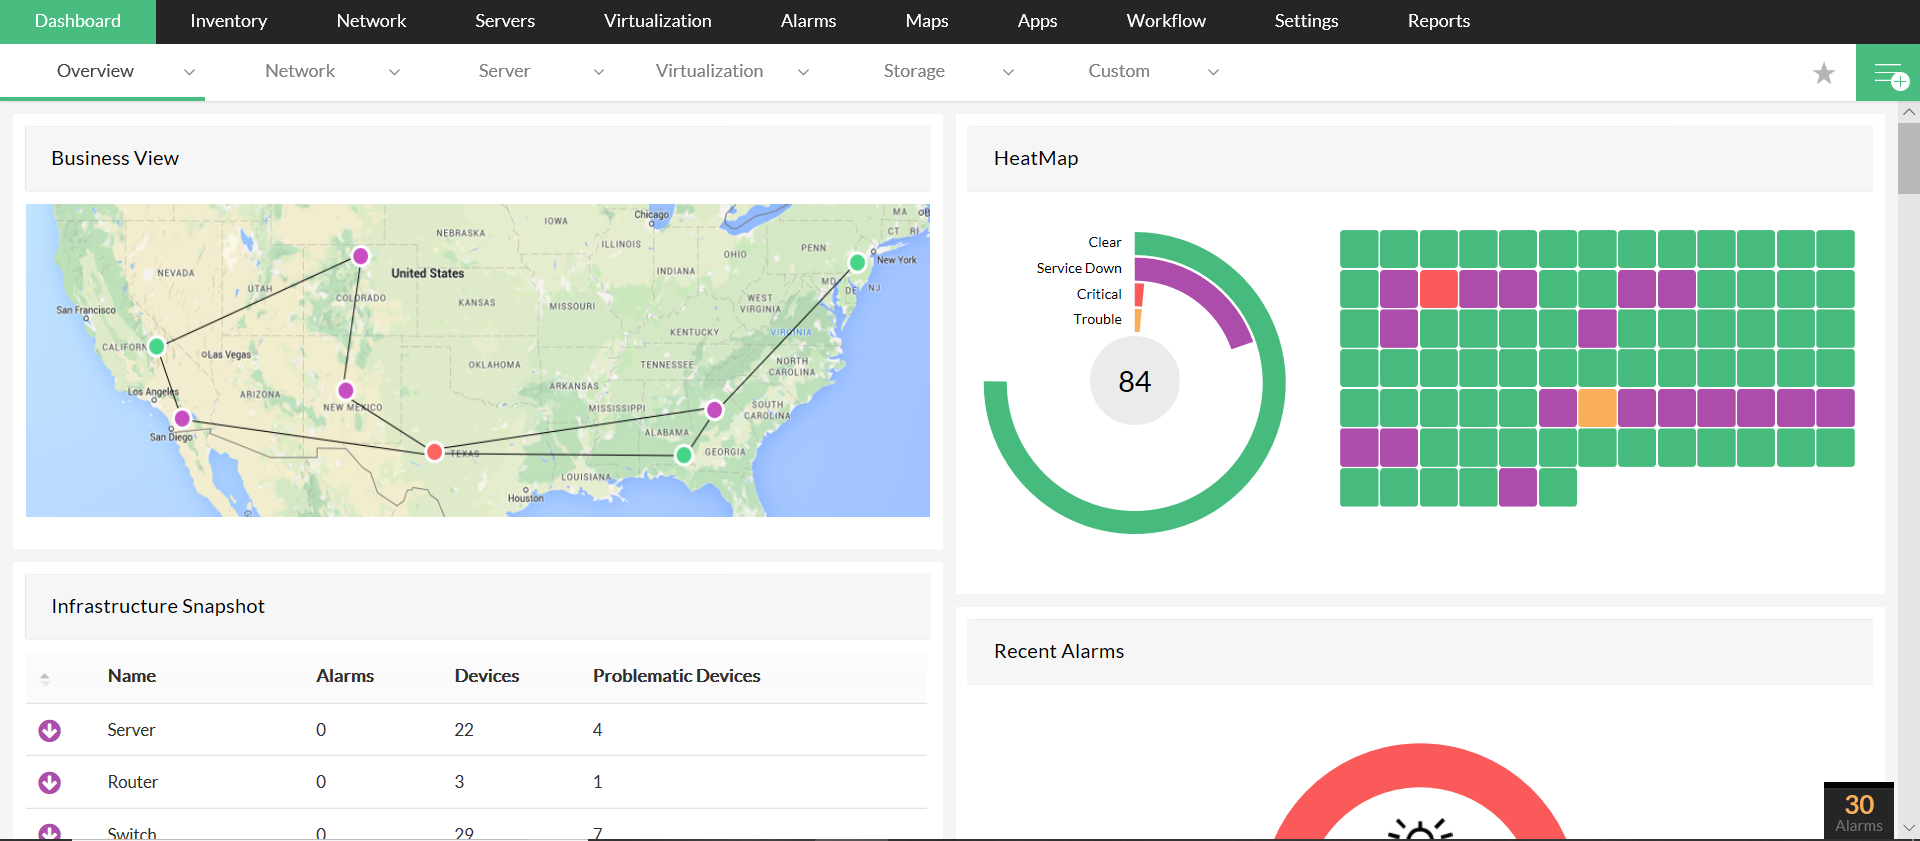
Ever wondered if it's possible to get a bird's-eye view of a huge network? It is! Use the HeatMap view to see the full picture for networks of all sizes. Large Enterprise Edition users can monitor up to 10,000 devices.
With networks becoming even more complex over time, having a robust network monitoring solution in place is crucial. OpManager offers comprehensive network monitoring capabilities that help you monitor network performance, detect network faults in real time, troubleshoot errors, and prevent downtime. Being a powerful network monitor, it supports multi-vendor IT environments and can scale to fit your network, regardless of its size. Monitor your devices and network to gain complete visibility and control over your entire network infrastructure.

Networks are the backbone of every business. Even in small or enterprise-level businesses, the loss of productivity during a network outage can result in hefty damages. Network monitoring helps you anticipate potential outages and address network problems proactively. This helps in maintaining a congestion-free network that keeps your business up and running.

Factors that impact network performance.
- Availability
- CPU and memory
- Traffic
- Errors and discards
- WAN performance
- Availability
When every minute of downtime can cost you thousands, if not millions of dollars, maintaining continuous uptime at all times is an absolute necessity. OpManager pings all monitored devices at defined monitoring intervals, and if any device is down or if the response time or packet loss is huge, OpManager notifies you immediately by sending an email or text message.

CPU and memory
High CPU or memory usage on a physical server, virtual machine, or network device can considerably affect the performance of devices and, in turn, affect the end user. OpManager lets you monitor devices using SNMP, WMI, Telnet, SSH, and VMware native API. With OpManager, you can detect and troubleshoot CPU and server bottlenecks before they affect the end user. You can also monitor important CPU metrics like utilization, speed, idle time, and processor time, and set independent alarm thresholds for each monitored device.

Traffic
Slow network traffic is a concern for every organization. Networks might face bandwidth-related issues due to a specific application, system, or WLAN. OpManager allows you identify bandwidth hogs so you can optimize your network traffic before it affects your network. Take charge of network performance monitoring by analyzing your network's bandwidth performance and traffic patterns with OpManager's Simple Network Management Protocol, which let's you monitor device traffic. You can view interface traffic, filter traffic by time interval, and view the last polled traffic value. OpManager's NetFlow module provides in-depth visibility on network traffic patterns and bandwidth utilization with support for NetFlow, sFlow, jFlow, IPFIX, and more.
Errors and discards
All network devices discard packets depending on their memory, which can effect performance. These problems are common with routers and switches. Since discards increase application latency, excessive discards could indicate that there's a problem with the switch or the device interacting with the switch. Insufficient bandwidth allocation is also a concern for packet drops. Network errors are diverse; they could be caused by a DNS issue, TCP timeout, or a lack of response from the server. A switch or router can misinterpret a packet due to a protocol mismatch when updating device configurations. OpManager helps you monitor and reduce the packet loss due to errors and discards.
WAN performance
Monitoring WAN links for availability and reliability is essential, as organizations require continuous uptime, fast response times, and minimal transmission errors, which makes monitoring WAN links for availability and reliability is essential. Most organizations use WAN links to interconnect local area networks (LANs) from different locations around the world. With OpManager, you can monitor your WAN connections, check WAN latency, and identify network traffic across your WAN network. This helps you allocate resources accordingly to prioritize traffic and react proactively to any issues affecting your WAN network. OpManager primarily relies on Cisco's IP-SLA for monitoring the WAN, while OpManager’s WAN Round Trip Time monitor provides details on WAN link latency, bandwidth utilization, the round trip time, and other performance factors for you to completely diagnose and resolve poor WAN performance before you can think of upgrading WAN bandwidth capacity.
Performance monitors
OpManager's predefined performance monitors help you take control of your devices and interfaces by setting up device-specific monitors to drill down on any particular aspect of a device that you want to monitor. OpManager supports setting up custom SNMP MIB variables and helps you manage and monitor performance for a wide range of devices from multiple vendors. OpManager supports the most commonly used devices in the market like Cisco, Palo Alto and Juniper.

If the performance counter you're looking to monitor isn't available, you can always get the SNMP MIBs from the vendor and create custom SNMP monitors. You can also load the WMI classes from the device and create a monitor.

Apart from this, you can monitor TCP ports for availability and response time; Windows services for availability; processes for availability, CPU, and memory; files and folders for availability, size, and age; Windows event logs; and syslogs from Linux and network devices.
If you're using scripts to extract certain values from servers, you can monitor them using the same values in our script monitor. You can also get alerts based on set thresholds and generate reports based on the monitored value.
Proactively monitoring network performance
Network downtime can cost a lot of money. This is why network monitoring is a necessity. OpManager, a powerful network performance monitor, lets you monitor all your devices for availability, performance, traffic, and other parameters, so you can monitor issues proactively and prevent problems from bringing down your network.
Benefits of proactive monitoring:
Helps network administrators get an end-user perspective of network and application performance, which helps them detect and resolve issues easily.
Allows admins to test how a network performs under a certain load so you can better understand your network's bandwidth and see whether or not you need to better allocate resources.
Aids admins in identifying security threats and sudden spikes in traffic levels to reduce device downtime.
Lets you monitor your IP assets and equipment upgrades, and ensures smooth performance.
OpManager lets you take control of your network with proactive measures like:
Multi-level thresholds
Instant-notification support
Multi-level thresholds:
Configuring thresholds lets OpManager proactively monitor the resources and services running on servers and network devices. OpManager supports multi-level thresholds for classifying and breaking down any fault encountered and for raising alerts before the device goes down or reaches critical condition. Based on the level of severity, you can respond with the respective corrective action. OpManager allows you to configure multiple thresholds for the monitors that are associated to a single device. You can also apply the threshold across multiple devices.

Instant notification:
OpManager can notify you through SMS and/or email whenever an alarm occurs. Administrators can also configure OpManager to run external programs or homegrown scripts automatically when an alarm is triggered. OpManager not only performs intelligent event processing, but it also correlates raw network events, filters unwanted events, and presents only meaningful alarms to the user. It uses color-coded alarms presented in a user-friendly format. Administrators can view the event history associated with an alarm and manually clear or delete them. OpManager also allows you to set escalation rules so that no alarm goes unnoticed.
Network performance reports
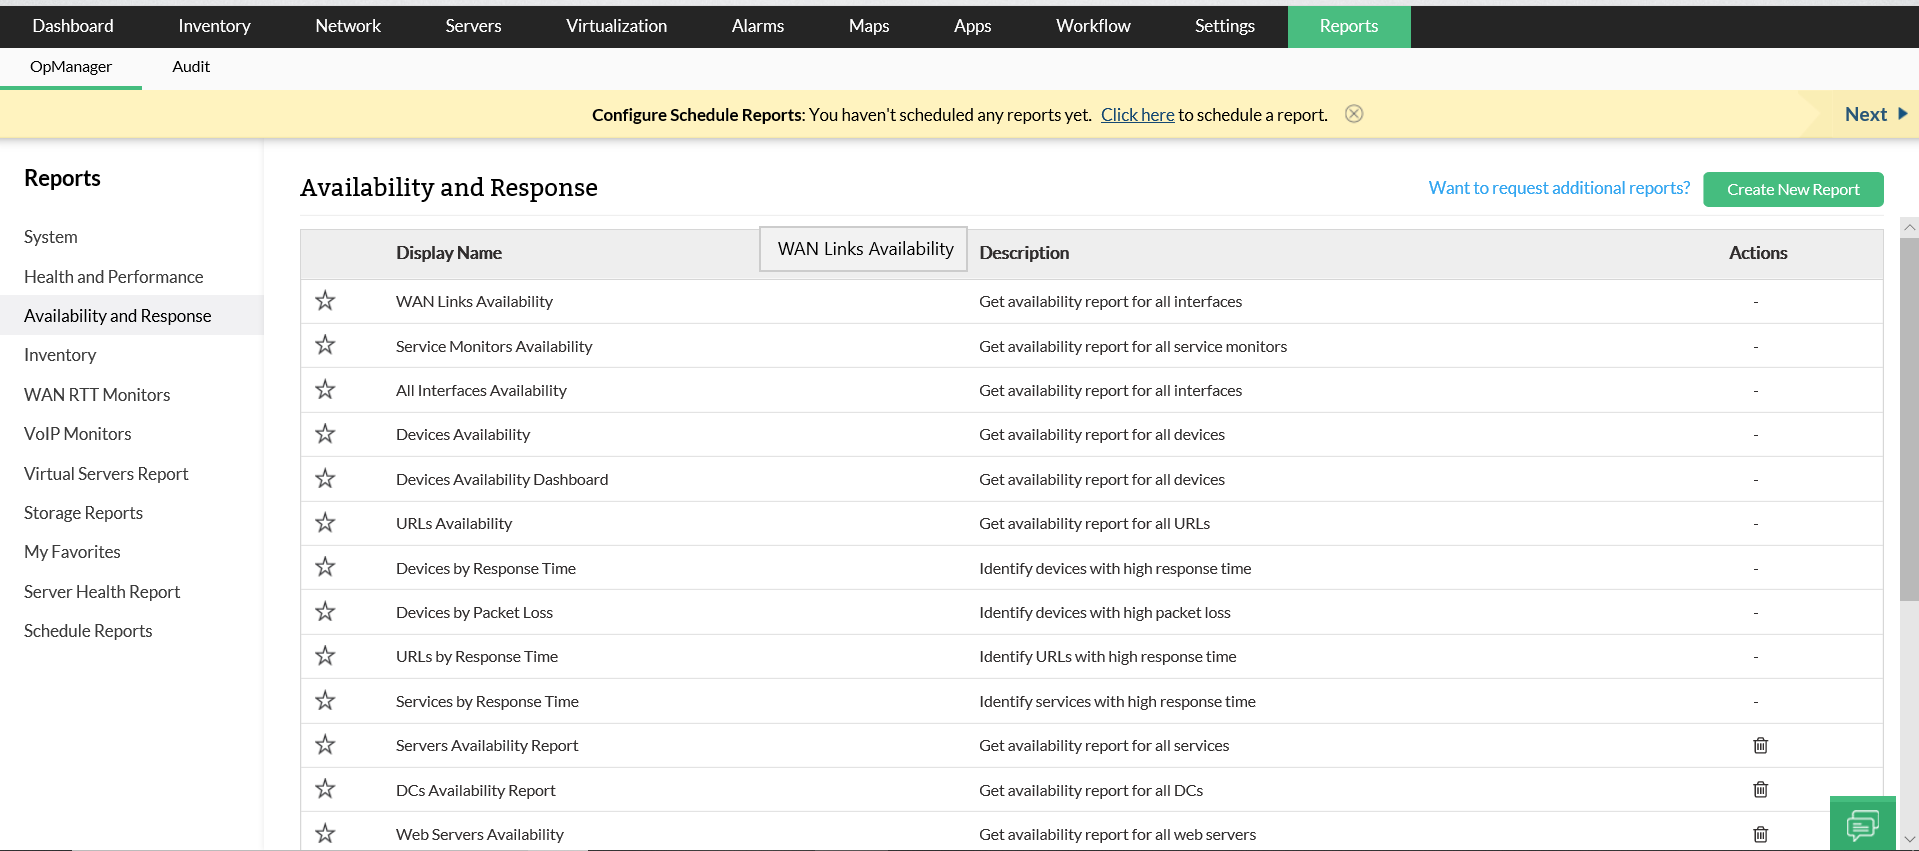
You might want to know how your network has performed over the year or within a specific time period. Tracking network performance metrics is easy with OpManager's Network Performance Reports. OpManager provides a simple interface with more than 100 built-in reporting profiles and over 125 out-of-box reports.
With OpManager, you can view intensive device performance reports like:
- Utilization reports on CPU, memory, and disk space.
- Incoming and outgoing interface traffic reports.
- Device health reports, which include trends on availability, response time, packet loss, temperature, etc.
- Service response time reports.
- Inventory reports listing various devices, their IP addresses, OSs, RAMs, and disk configurations.
You can also create customized reports using OpManager.
With OpManager, you can export and save every report as a PDF or XLS file with the option to print or email them. You can also export reports as widgets and use them on your dashboard.

Network performance dashboards
OpManager provides customizable dashboards and various visualization options, which you can customize to suit each employee, from technicians to IT managers. Each user has the option to choose different widgets and customize the dashboard based on their needs. You can create your own floors and racks as they are in the data center and view the status of those devices using OpManager's 3D data center. If you just want to view a group of devices and the links between them, you can group them in the business view.

Ever wondered if it's possible to get a bird's-eye view of a huge network? It is! Use the HeatMap view to see the full picture for networks of all sizes. Large Enterprise Edition users can monitor up to 10,000 devices.


No comments